Research |
KEY WORDS
evolutionary prediction, macroevolution, evolvability, quantitative genetics, phylogenetic comparative method, measurement theory, geometric morphometrics, big data, phenomics, brain size evolution, allometry |
1. Quantitative genetics and macroevolutionQuantitative genetics is widely recognised as a powerful framework to study evolution at generational, microevolutionary, time scales. To what extent can we use the established theoretical and methodological tools of quantitative genetics to study evolution at longer, macroevolutionary, time scales? My research addresses this question through two approaches.
On the one hand, I use phylogenetic comparative methods to infer the pattern of evolution in deep time. The core thesis here is that the theories and methods of quantitative genetics can profitably be used on a phylogenetic scale to illumine the connection between pattern and process. I conduct large-scale phylogenetic comparative analyses of phenotypic evolution and develop novel methods to study character evolution on phylogenies. On the other hand, I study populations of the blue-tailed damselfly (Ischnura elegans) that has been long-term (> 20 years) monitored by my collaborator Erik Svensson. These populations are extensively surveyed every year that allows me to measure phenotypic selection from > 1,500 individuals every year. Currently, I have this data for 4 years. I combine this field survey with experiment to obtain 2 components of evolutionary change: genetic variance and selection. The goal of my research is to cross-validate the evidence obtained from these two approaches in light of quantitative genetic and macroevolutionary theories to illuminate the link, and the lack thereof, between microevolution and macroevolution. |
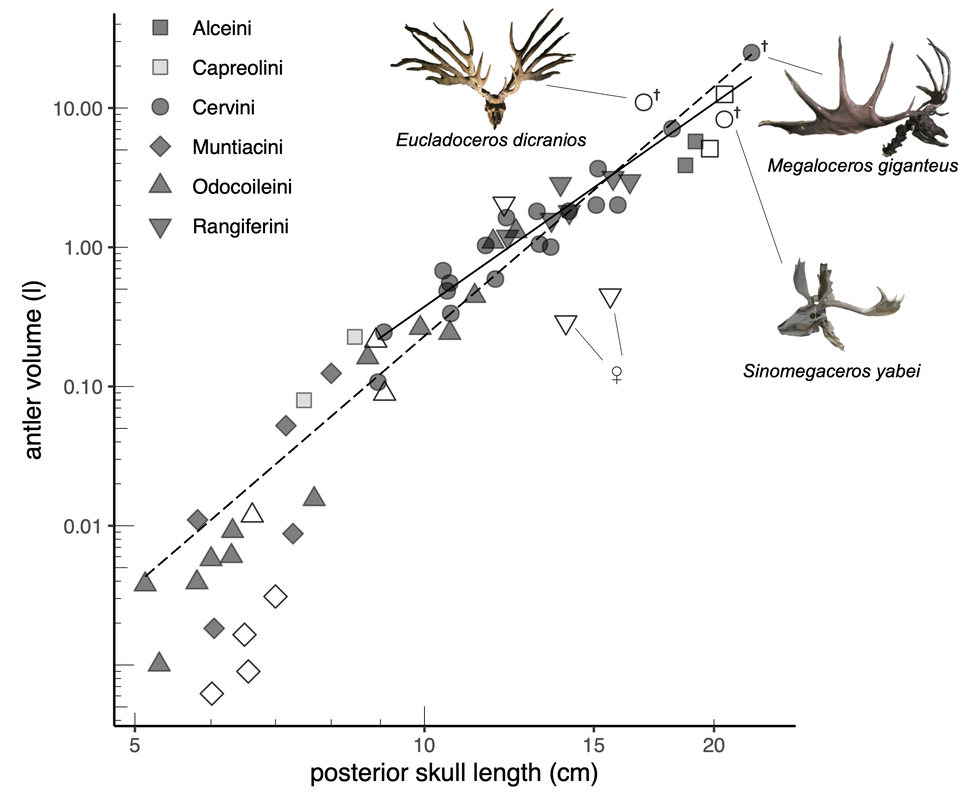
Evolutionary allometry of deer antler size. The relationship between antler volume and skull length among extant and extinct deers are shown. From Tsuboi et al (submitted).
Diversity of Odonata. Photo credit: Erik Svensson, Wikimedia Commons.
|
|
CV applied to measure insect wing. Slideshow presents a wing of the bluetail damselfly Ischnura elegans undergoing a various processes CV operations. Segmentation, heat-mapping, and informed feature identifications are shown as examples.
PHOTOGRAMMETRY allows a quick and easy reconstruction of 3D surface image. The above image is a skull of Reindeer Rangifer tarandus reconstructed from c.a. 50 photos. By calibrating the image using the scale photographed together with the skull, we can estimate the volume of antler without physically measuring it at all.
|
2. PhenomicsNew tools to measure phenotype bring us an exciting opportunity to compile massive amount of phenotypic data of high complexity. However, applications of these techniques in biological questions are not as fully explored as genomic tools. I am currently running several projects that use large amount of phenotypic data acquired through new techniques.
I use computer vision (CV), an automated extraction of information from digital images, to acquire big and high-dimensional phenotypic data (phenomic data). Collaborating with Seth Donoughe and Arthur Porto, I implemented a suite of CV-methods to measure phenomic data of insect wing venation pattern from high-resolution scanned images of insect wings (currently applied to Diptera and Odonata). So far, I used this method to measure > 12,000 wing images. Every year, I obtain about 5,000 images from damselflies captured in natural populations. Another tool that I use in my research is photogrammetry. Unlike more fancy technologies such as surface scanners, CT, or MRI, photogrammetry uses images taken from cheap and widely available imaging devices (including smartphones) to reconstruct a service image of objects. This is enormously flexible and cheap tool, helping to establish bespoke setup to study biological samples of varying size and shape. I applied this to measure skulls of the deer and currently hold a dataset with > 600 specimens including all extant species and 3 fossil species. In a long term, I envision to construct insect wing dataset as an open resource for computer vision researchers and biologists. Insect wing is relatively well preserved in museum specimens and largely a 2 dimensional trait. These features make insect wing an unusually suitable system to apply and test new computer vision tools. |
3. Brain size evolution
|
Why brain size is so variable across vertebrates? What makes some animals having larger brains than others? What limits evolutionary brain size enlargement? During my PhD, I studied these questions in cichlid fishes from Lake Tanganyika and pipefishes/seahorses using phylogenetic comparative methods.
I am particularly interested in brain-body allometry. In the second chapter of my PhD thesis, I reported that the slope of brain-body allometry within species (static allometry) is strongly conserved across 40 cichlid species, indicating that this parameter may be an important evolutionary constraints for brain size evolution. I recently published a study of brain-body allometry at the across-vertebrate scale. I show that birds and mammals are exceptional for their shallow static allometric slopes compared to other groups. I further reveal that the breakdown of static allometries is related to the extension of fetal brain growth period. These results indicate that evolvability of ontogenetic processes plays an important role in macroevolution. This study stands as one of few examples where the consequence of evolutionary constraint and its mechanistic basis are shown together. The data we collected and curated are freely accessible and reusable from the Figshare repository. |
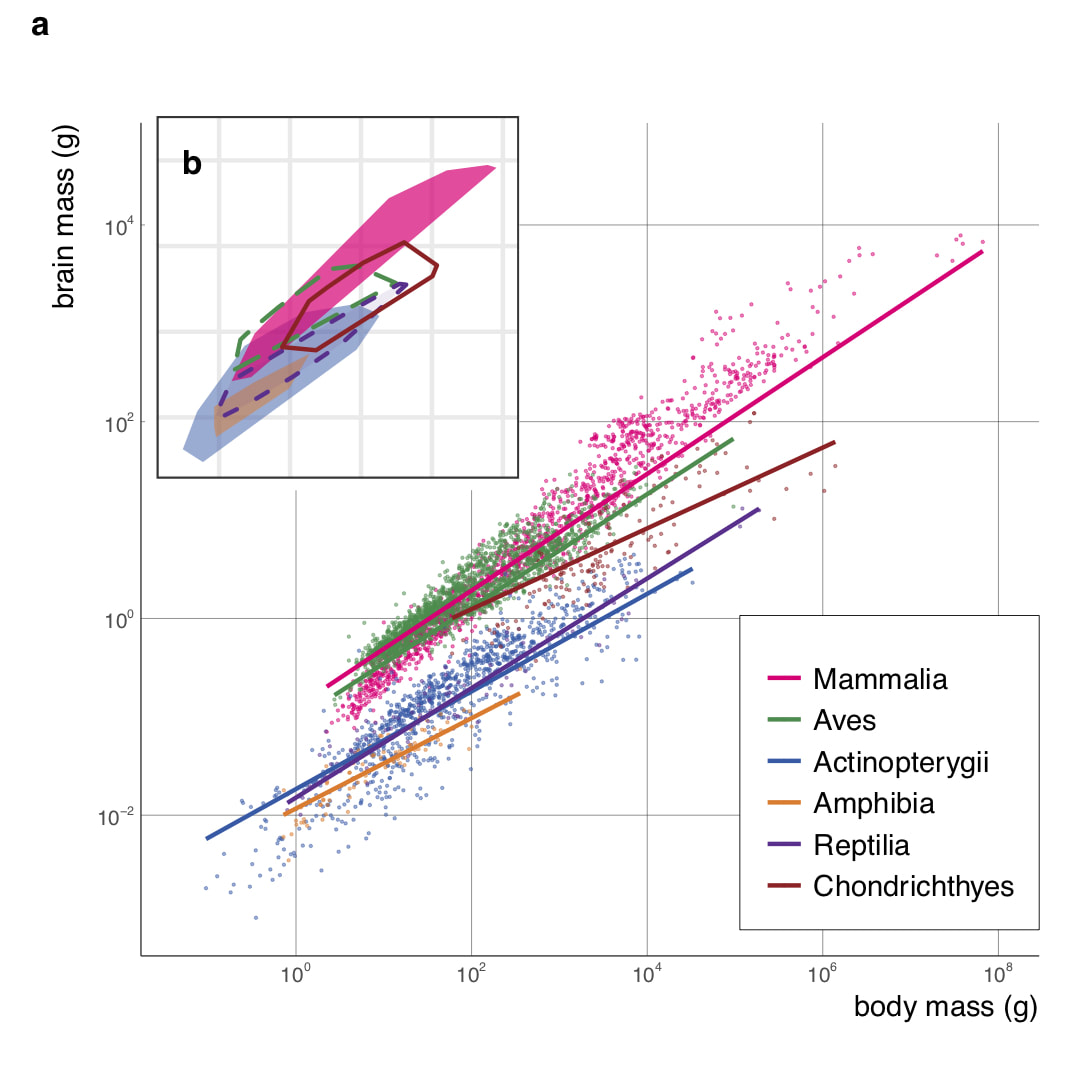
Brain–body evolutionary allometry of six vertebrate classes. a) Class-level brain–body allometries of six major vertebrate lineages are shown in different colours (x and y axes are in log10 scales). Points represent species means and unbroken lines are least square regressions accounting for phylogenetic relatedness among species. b) shows minimum convex polygons of the morphospace occupied by Actinopterygii (N=963), Amphibia (N=86), Aves (N=1902), Chondrichthyes (N=147), Mammalia (N=1409) and non-avian reptiles (Reptilia, N=79).
|